Loading …
Vienna in Figures
Information Design
Statistics has a long tradition in the city of Vienna: the first yearbook with around 300 pages was published as early as 1883. Today, with the extensive data from more than 130 years, the development of Vienna in all areas of life can be traced very well.
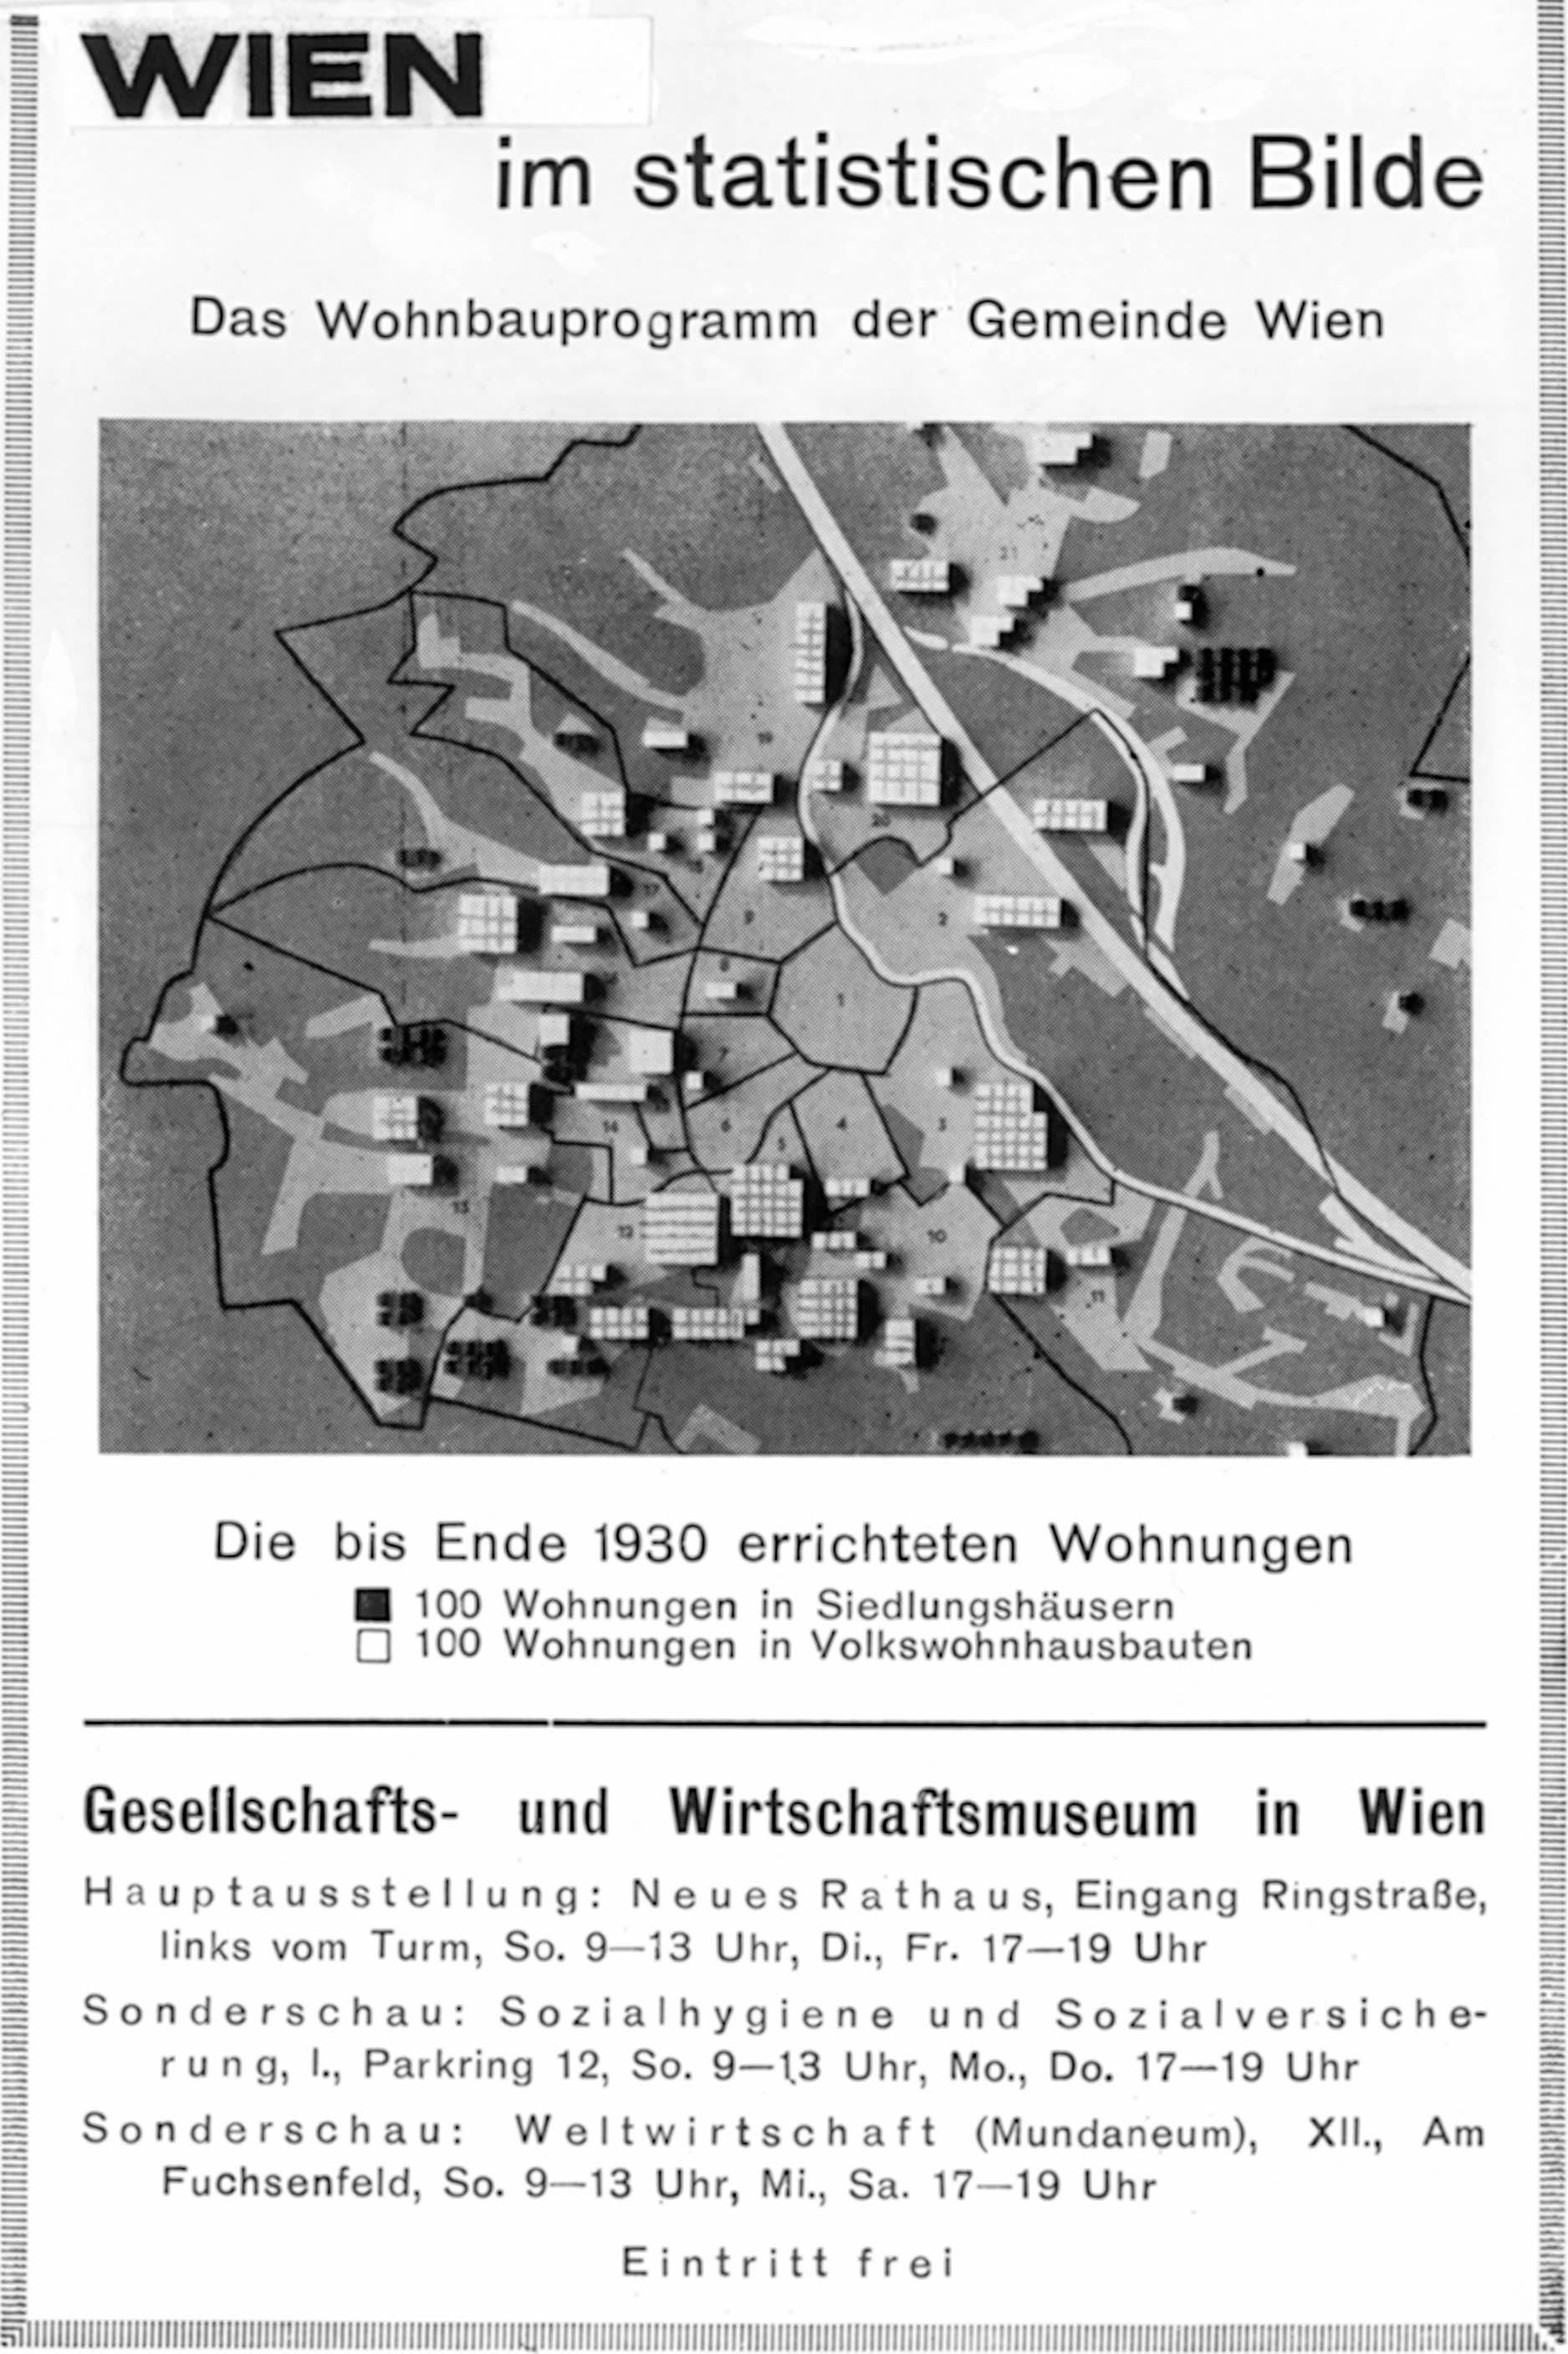
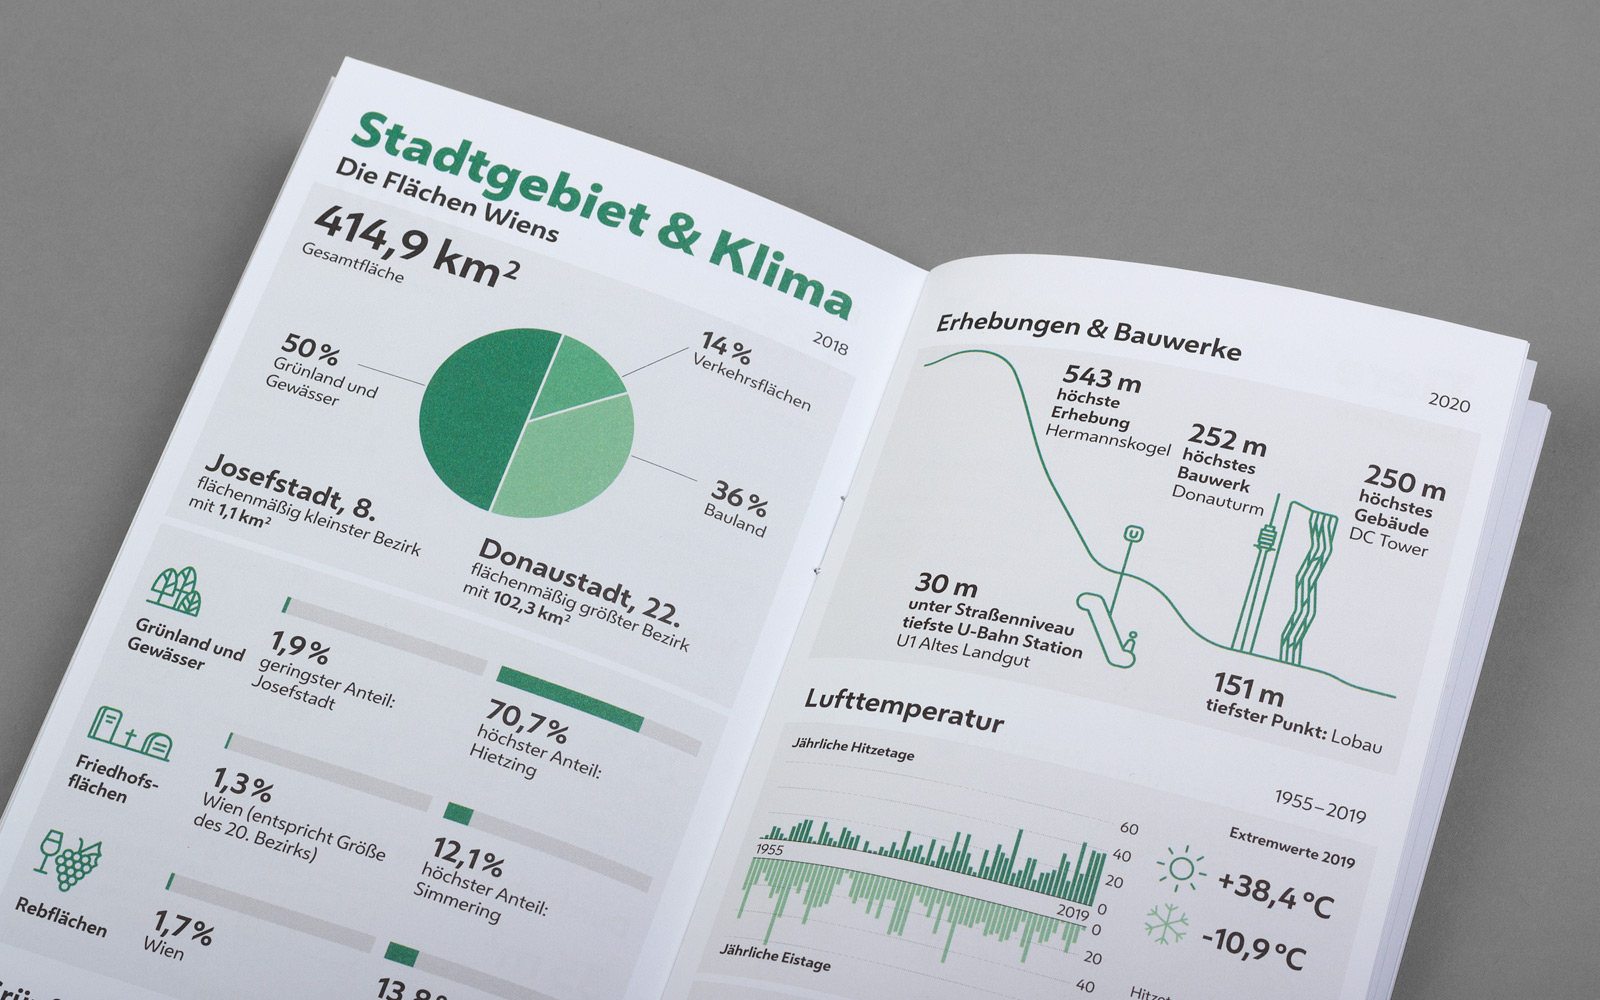
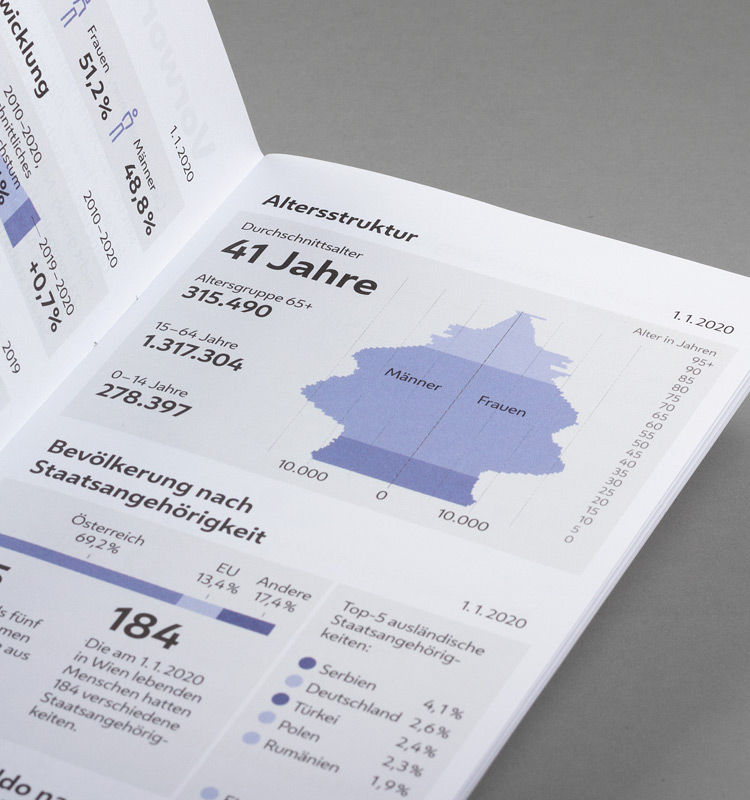
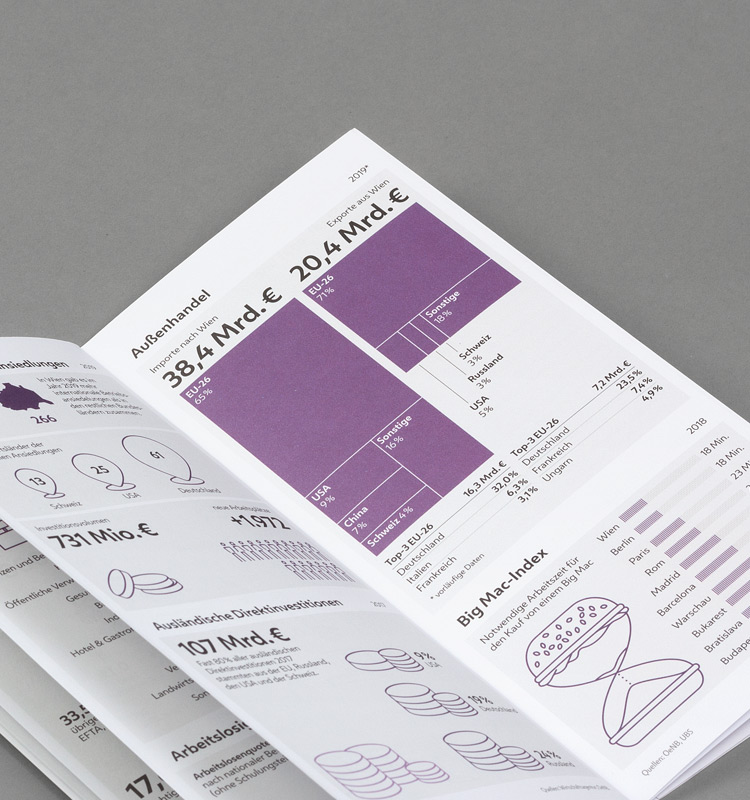
The current publications “Vienna in Figures” present a selection of meaningful facts in the areas of climate, transport, economy, education and culture, making information easily accessible and transparent for everyone. In doing so, we follow the idea of democratically imparted knowledge for everyone, which the Viennese information pioneer Otto Neurath developed in the 1930s with his ISOTYPE method. He is thus the founder of modern information design, which is currently experiencing a boom.
Vienna is the fifth largest city in the EU after Berlin, Madrid, Rome and Paris. It is growing, changing in all areas of life and is expected to reach 2 million inhabitants again in 2027. These and other key figures can be found on the poster that provides direct and easily accessible information in public facilities throughout Vienna.
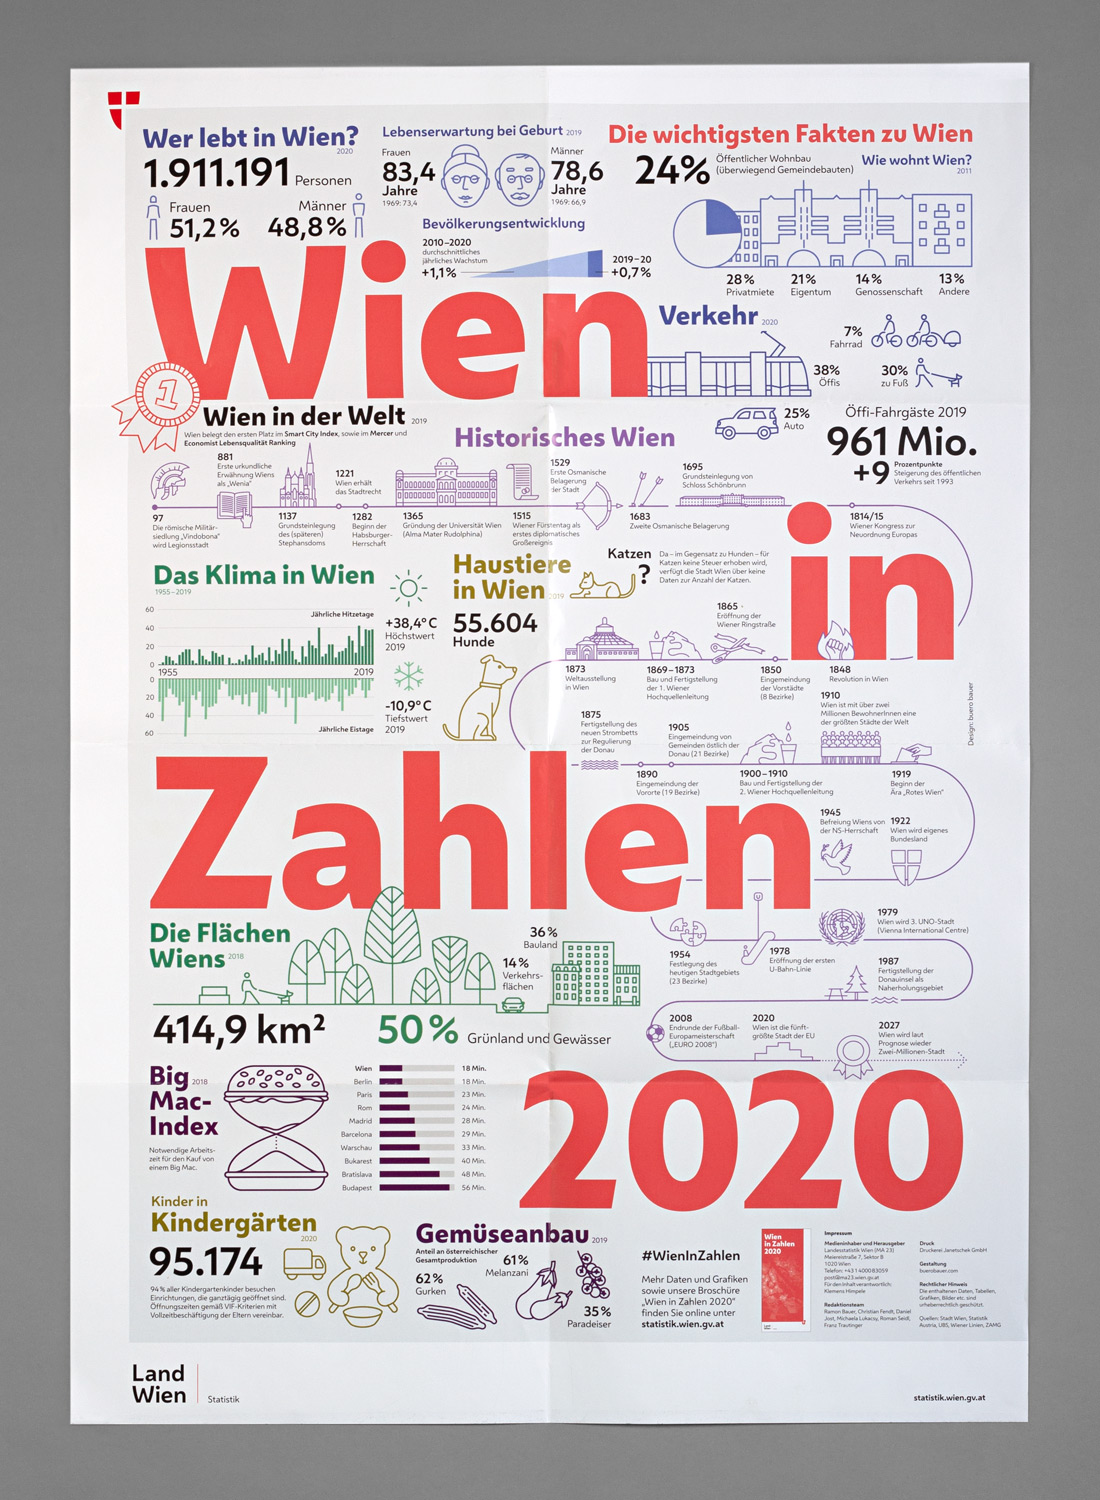
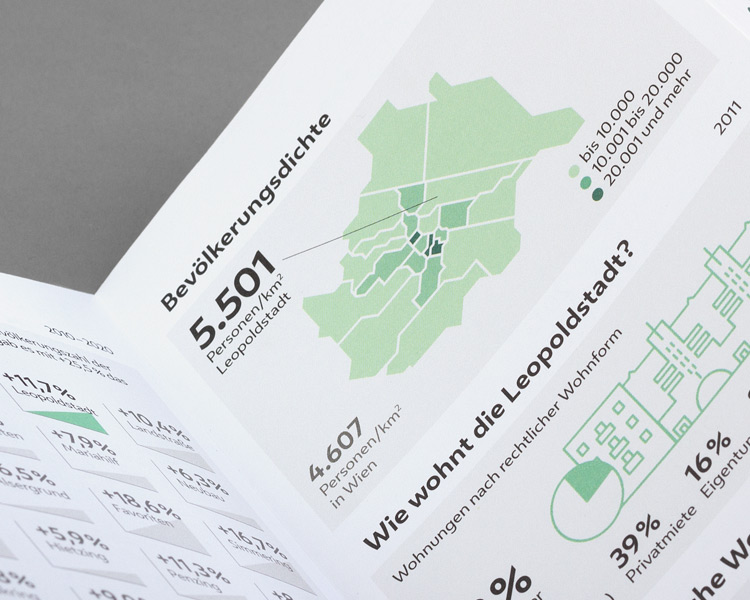
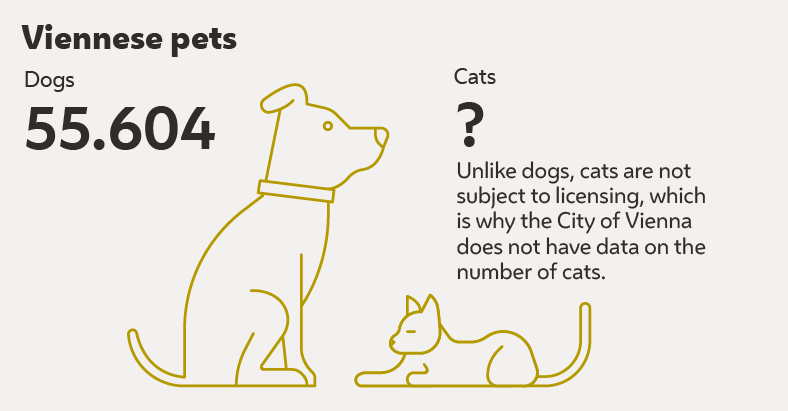
The compact brochure “Vienna in Numbers” invites you to get to know Vienna better, to understand abstract numbers in concrete terms and to discover things that were previously hidden. However, the statistically based facts also offer one or two surprises: the number of cats in Vienna is simply missing because they are “tax-free” and therefore cannot be counted.
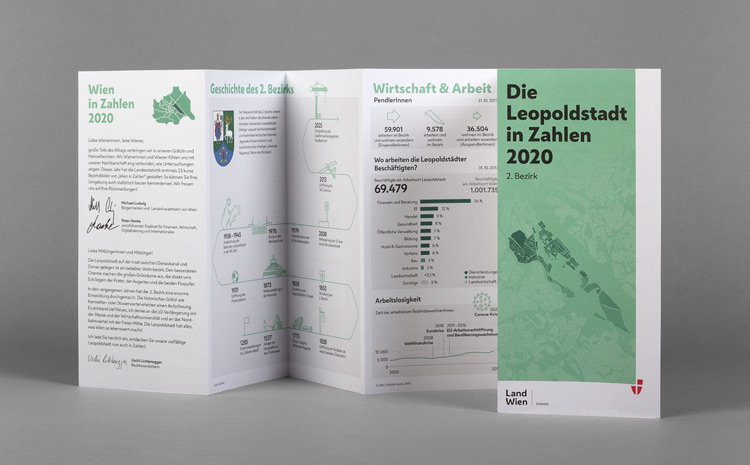
In 2020, we designed the brochure “Vienna in Figures” for the first time in the look of the new corporate design of the city of Vienna. The characteristic “Melange” font and the reduced line illustrations, which tell stories about the facts, are formative. For the first time, an extensive library of illustrations in the new design style was created as part of the new appearance.
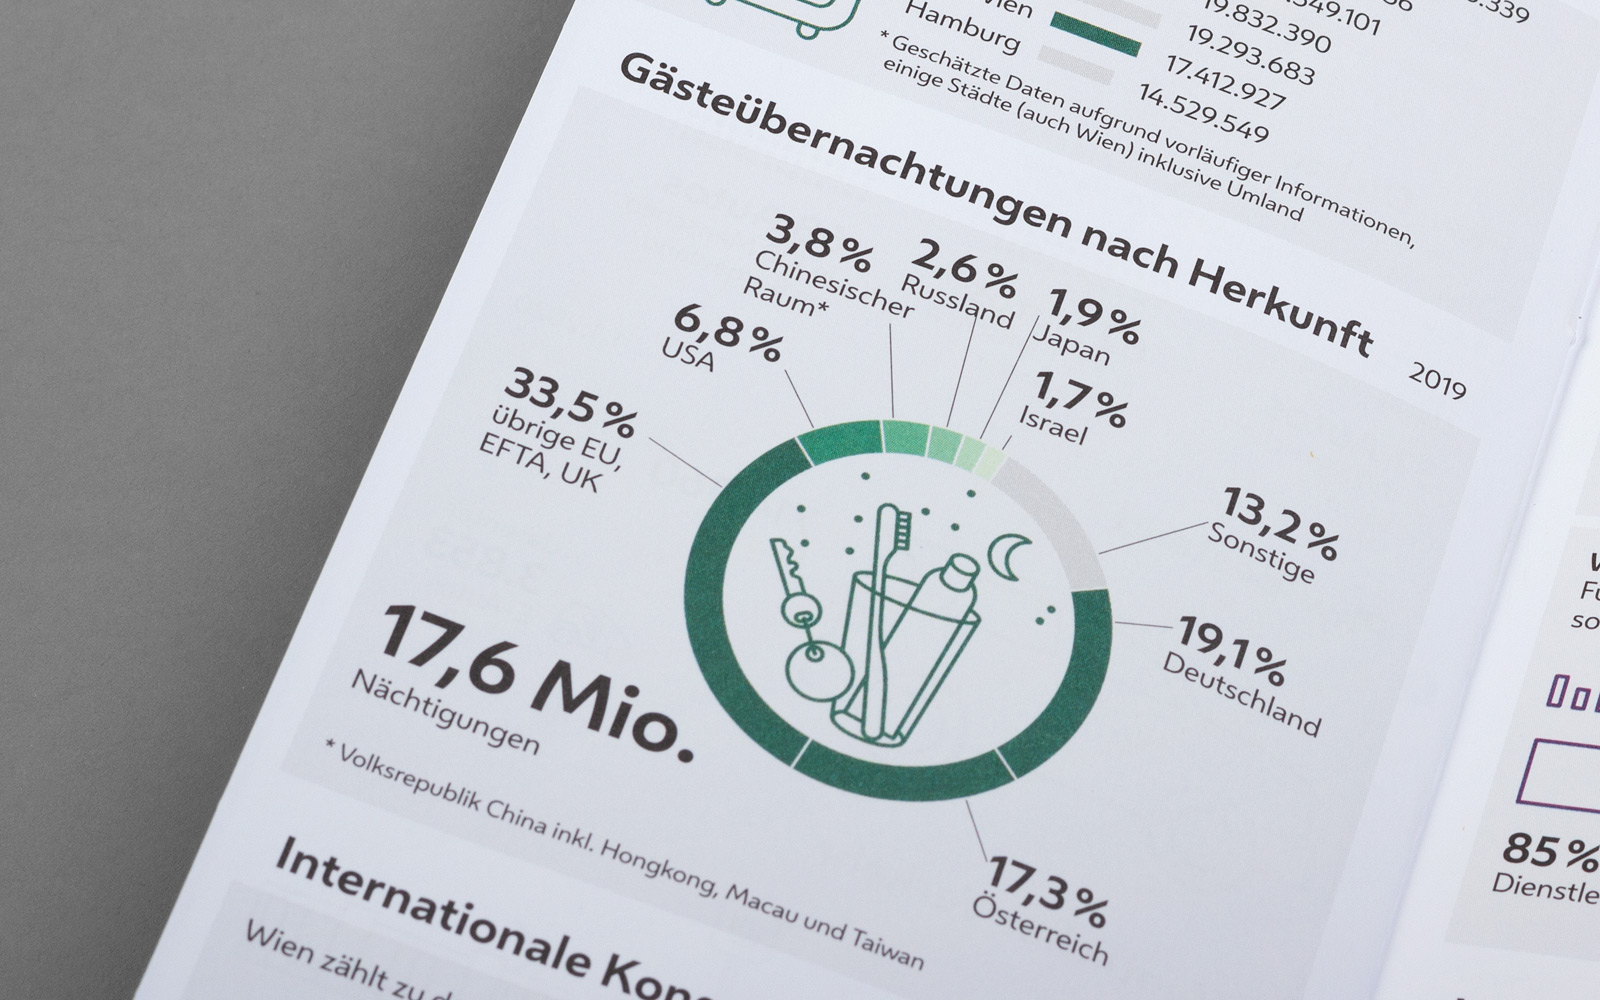
By comparing 2020 with 2021 and 2022 (currently in progress), significant developments can not only be clearly understood, but also traced back to concrete influences such as the COVID-19-pandemic. An example of this is the significant decline in overnight stays compared to previous years.
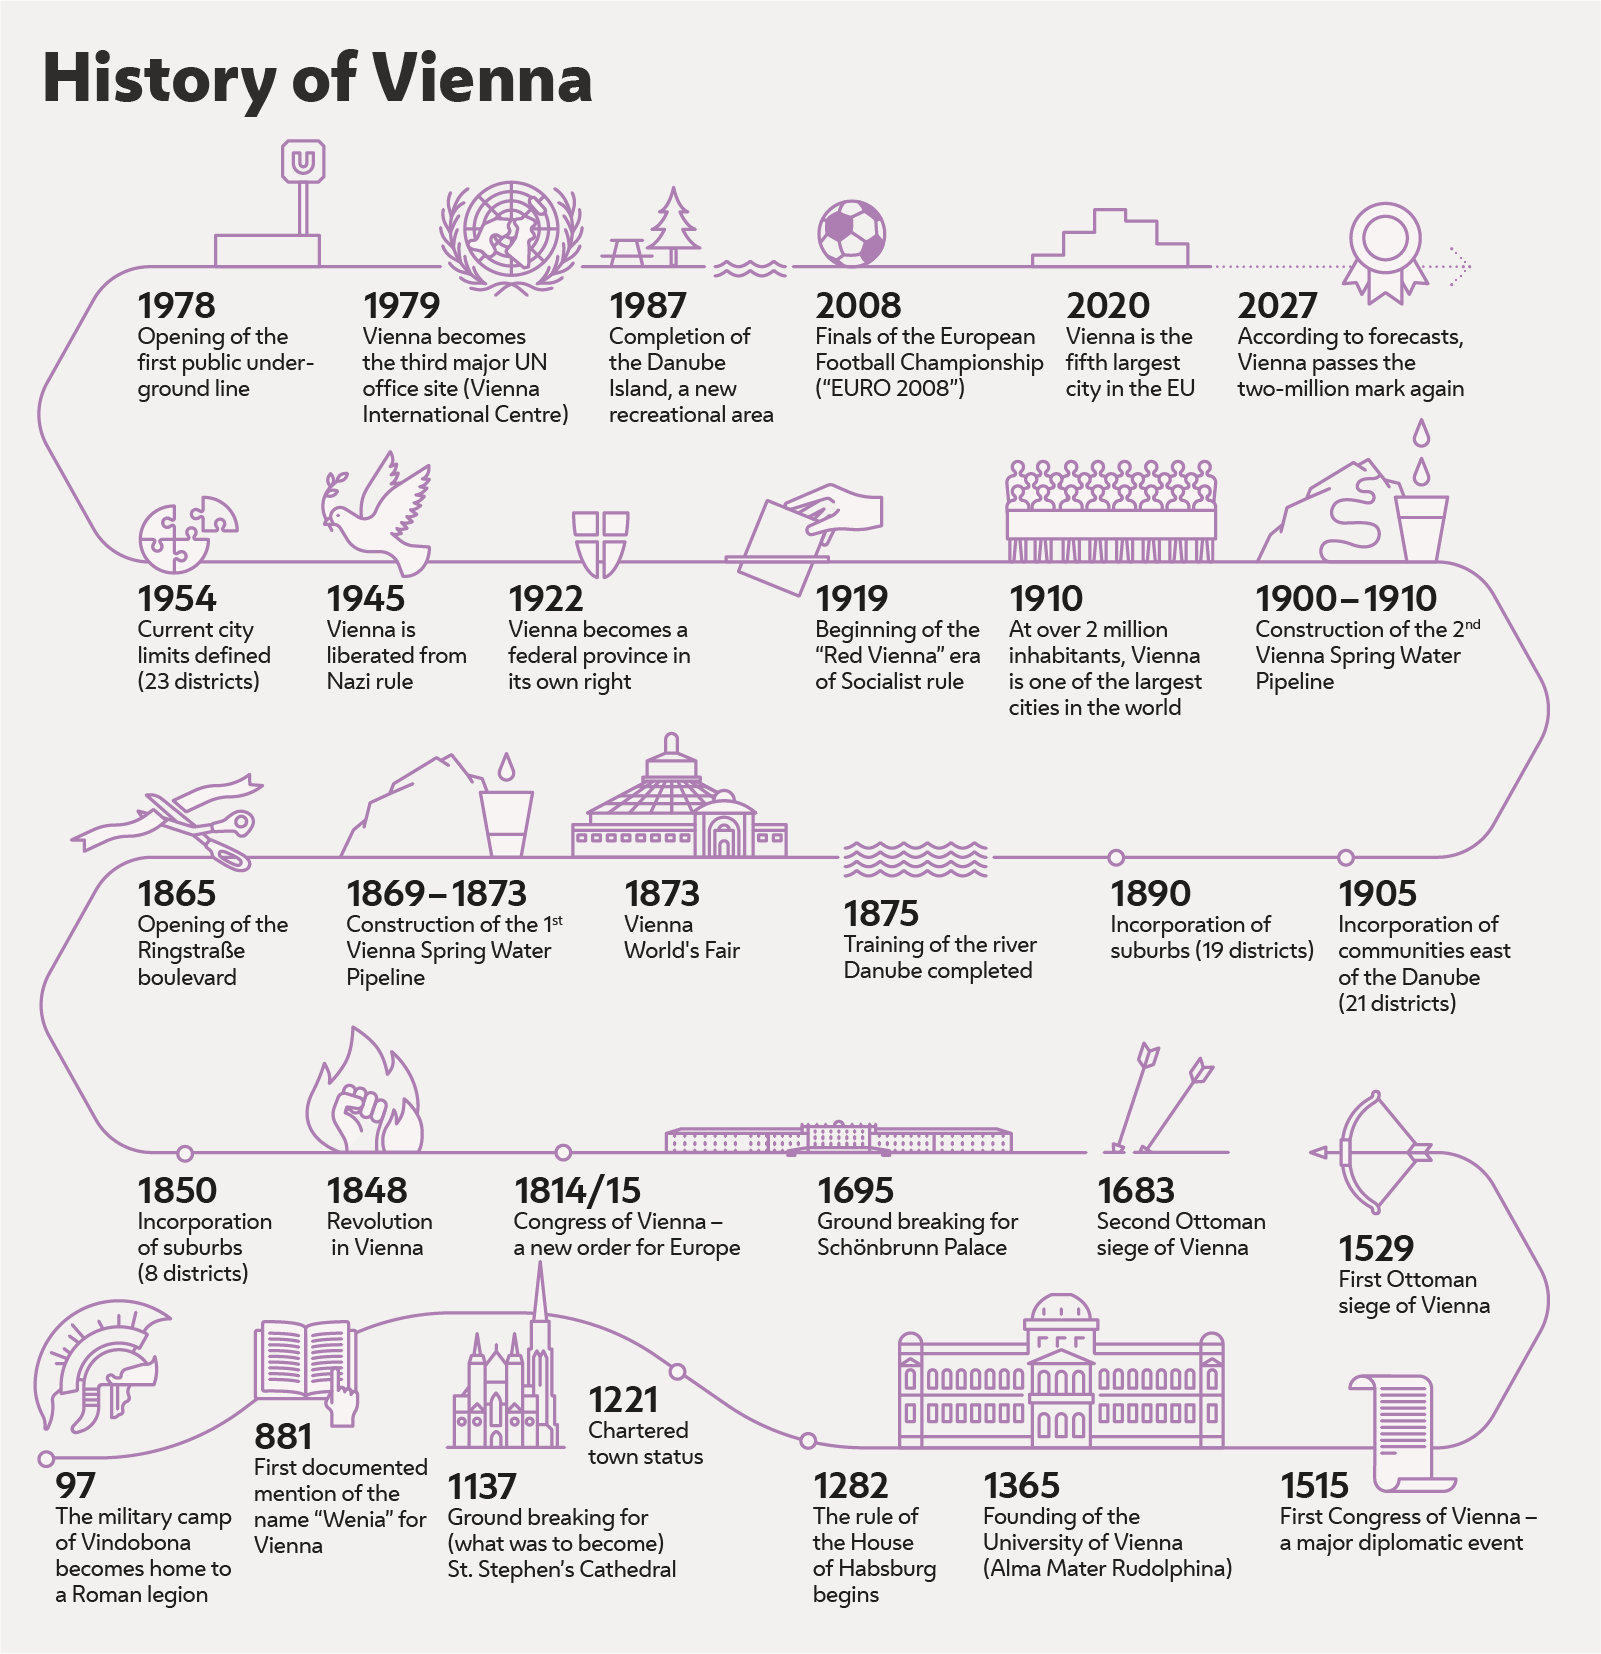
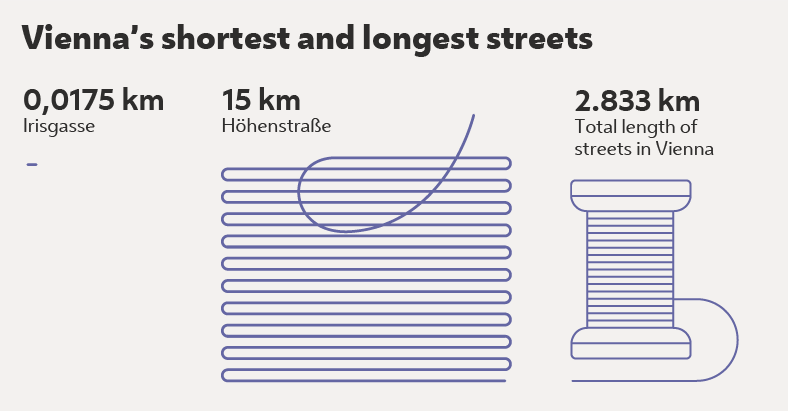
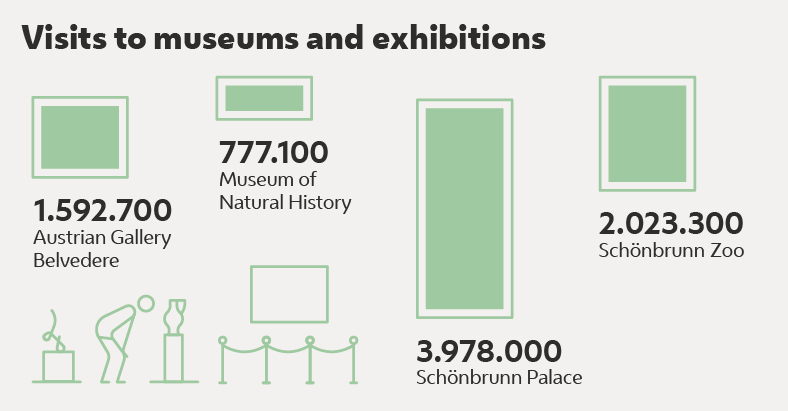
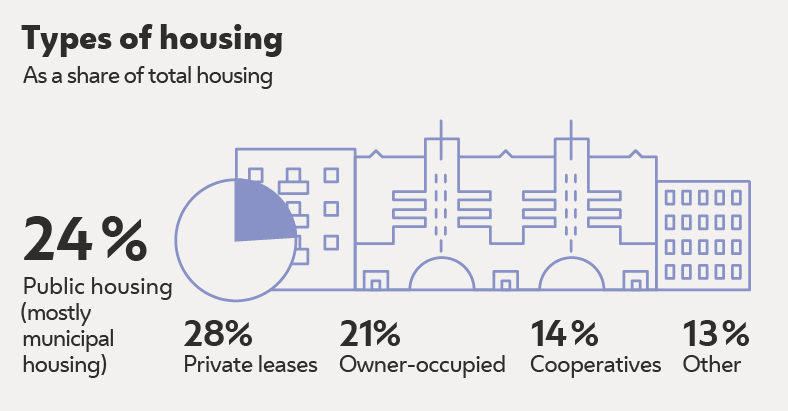
Thematically bundled and focused on core statements, we make facts tangible, connections understandable and developments comprehensible with our reduced information design. It relies on the combination of classic data visualization, comparisons and charts in combination with significant illustrations.
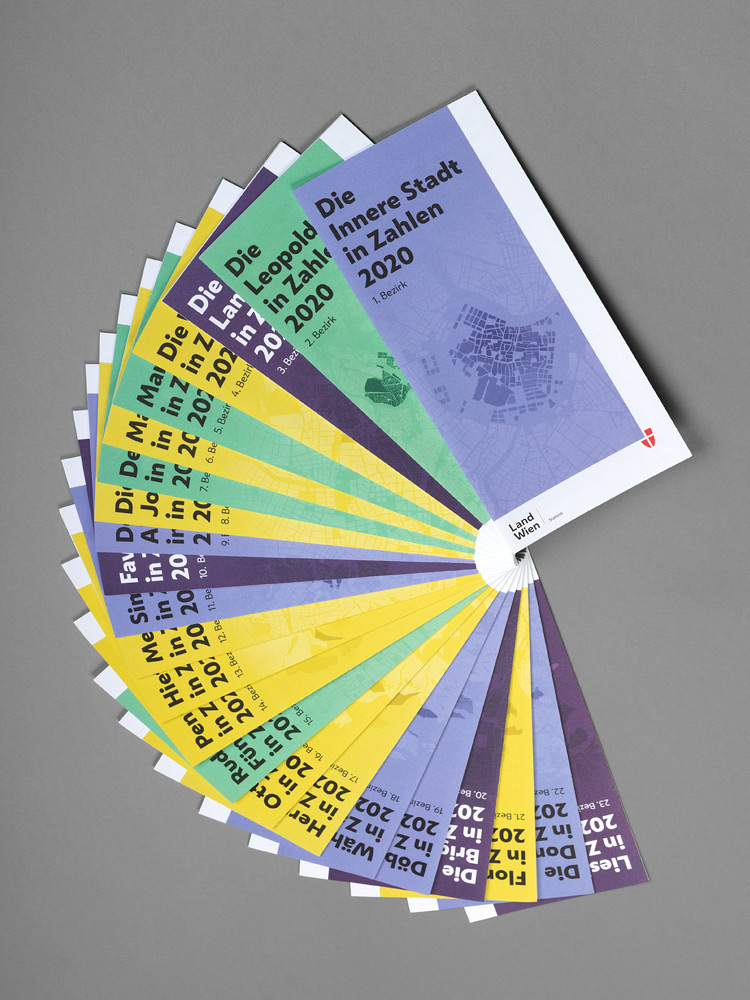
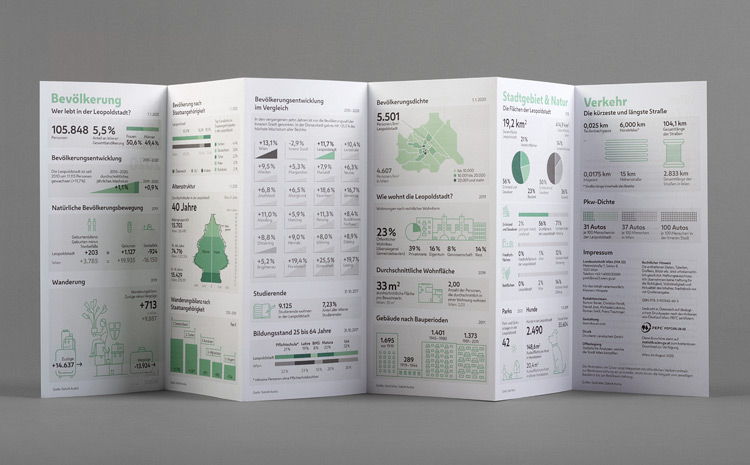
For each district, locally relevant figures were placed in the larger context of Vienna as a whole. The 23 leporellos provide surprisingly detailed information with likeable Viennese local humor and tell a variety of stories from the personal living environment of all Viennese.